πŸ” Diagram Visual Indicators

We're thrilled to announce an important update that will change your diagramming game. Confused between primary keys and foreign keys? Worried about those sneaky table/field notes and non-null fields? Worry not, we’ve got your back with Iconic Empowerment and Enlightened Text Styling.

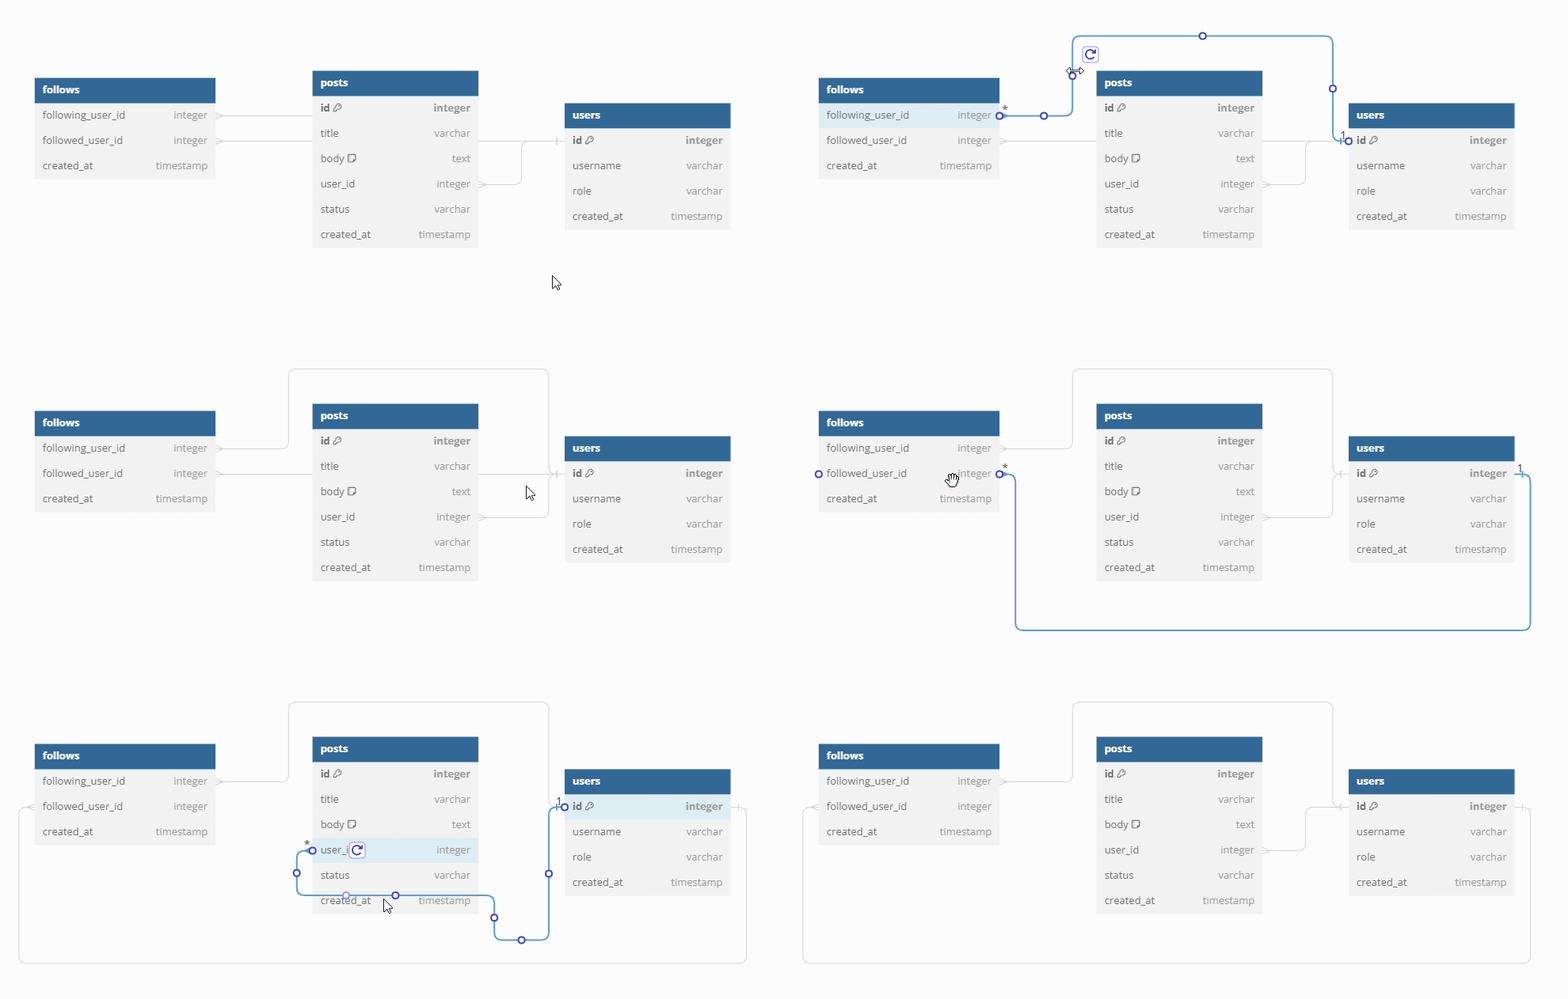
  • πŸ”‘ Crystal-clear Visual Indicators: No more mixing up primary keys with foreign keys. Our feature introduces distinctive icons that catch your attention and clarify keys within your diagrams. Bid farewell to key confusion and enjoy precise understanding.

  • πŸ’‘ Note Visibility: Note-related anxiety is gone. With our enhanced feature, spotting tables and fields with attached notes is a breeze. Rest assured that no important details will slip through the cracks.

  • ✨ Enlightened Text Styling: Improve the readability and comprehension of your diagram with text styling. Wave goodbye to the chaos of non-null fields and the risks of forgotten enum values.

Diagram visual indicators

No more guessing games or diagramming headaches. It’s time to simplify and enhance your workflow.

We value your feedback, so please don't hesitate to share your thoughts and suggestions.


πŸ“ˆ Diagram Detail Levels

We've been listening closely to your feedback, and we understand how challenging it can be to work with diagrams containing hundreds of tables and thousands of columns. As a result, we're pleased to present Diagram Detail Levels.

You can now toggle between displaying all columns, displaying only key (PK, FK) columns, or even hiding all columns, providing a global switching option for the entire diagram. Adjust the detail level to your needs, from a high-level overview of the entire database to specifics on individual tables.

Adjust diagram detail levels

This feature is available in the Personal Pro plan. Visit our pricing page to learn more.

We value your feedback, so please don't hesitate to share your thoughts and suggestions.


πŸš€ Publish dbdiagram to dbdocs

We are pleased that dbdiagram has assisted many individuals and teams in database design and implementation.

However, we believe database development does not end there.

While dbdiagram aids in the early stages of database design, dbdocsβ€”a tool that helps you generate database documentation pages from the same database definition (DBML) in dbdiagramβ€”can help you improve the transparency and visibility of your database projects by streamlining collaboration and communication with your team.

To take a further step in combining these two products, we're thrilled to announce a new feature: the ability to publish your dbdiagram to dbdocs!

Simply click the "Publish to dbdocs" button in the header, then choose whether to publish new database documentation or update existing projects in the dbdocs account associated with your email.

Publish dbdiagram to dbdocs

FAQs

  1. What happens if I update a diagram after publishing it to dbdocs? Will the dbdocs document automatically update?

    Changes to your diagram will not automatically update the dbdocs document.

  2. What if I don't already have a dbdocs account?

    We’ll automatically create a dbdocs account with your email address.


As always, we appreciate your comments and suggestions. Please give this feature a shot and let us know what you think.


πŸ–₯️ Improvements In Code Editor

As developers, we understand that the editing experience is something that you care about! Hence, we are excited to share that the editor on dbdiagram has been improved significantly in this new release!

Improved look and better experience​

  • Press F1 to see the command palette and explore familiar shortcuts! (powered by Monaco Editor). Enjoy shortcuts such as:
    • Shift + Alt/Option + Up to copy a line up
    • Ctrl/Cmd + D to add selection to next match
    • and many more!
  • Minimalistic and sleek design that is aesthetically pleasing to the eye (powered by Monaco Editor)
  • Easily toggle your code editor with the Cmd + \ shortcut, and enable the editor to increase up to 50% of your screen width. Your preferred editor size will be remembered as well the next time you come back to work on your diagrams.

Code Editor

Zooming to diagram elements from the code editor​

No more wasting time searching for the correct table in complicated diagrams. You can easily find which part of the diagram you want from the code at any time.

To zoom in on a table/table group/relationship, use Cmd/Ctrl + Click or Cmd/Ctrl + F12.

Code To Diagram

Feel free to share your thoughts on our community.


πŸ“‹ Customizing Table/Field Notes with Markdown

To enrich your table/field descriptions, you can now use Markdown syntax to present code blocks, sample data tables, related URLs, and so on.

On the other hand, by changing the way we display notes (in a separate popup), we hope you will find it easier to read long notes that were previously narrowed in small tooltips.

Before: Old Table Notes|100x50

After: New Table Notes with Markdown supported|690x379

Feel free to share your thoughts about the feature on our community.